Reference levels

Reference levels
The widget is used to determine resistance and support levels. The reference levels will help to determine:
- zones of increasing movement dynamics
- market trend reversal points
- support and resistance lines
Instruction
The table has levels by type of definition: Pivot, Woody, Fibonacci, and Camarilla.
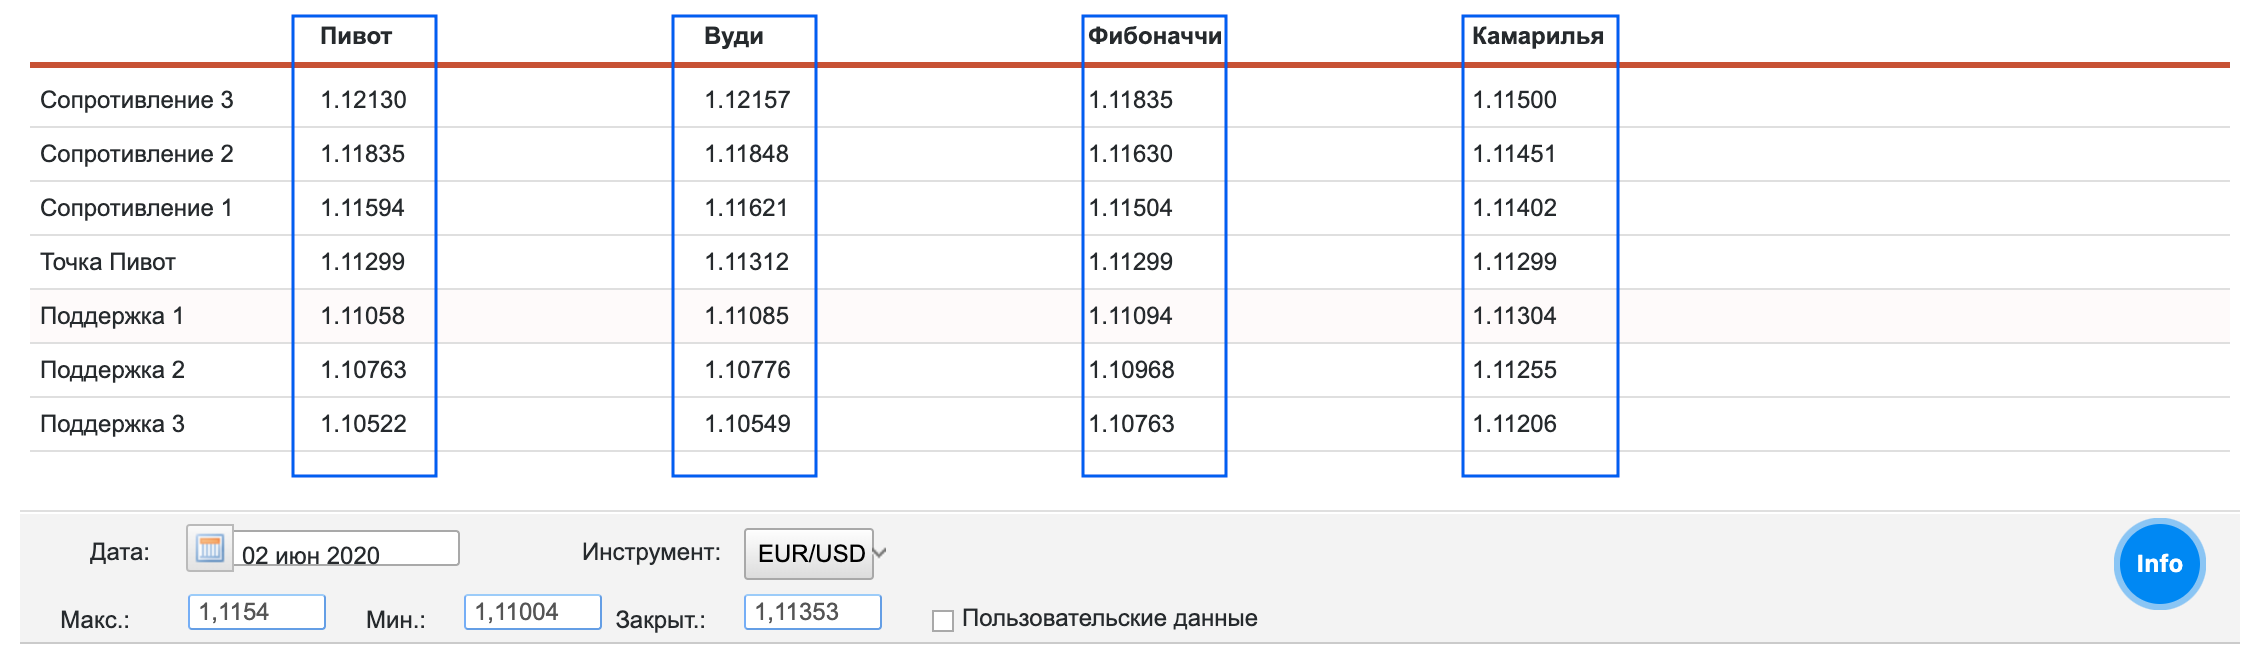
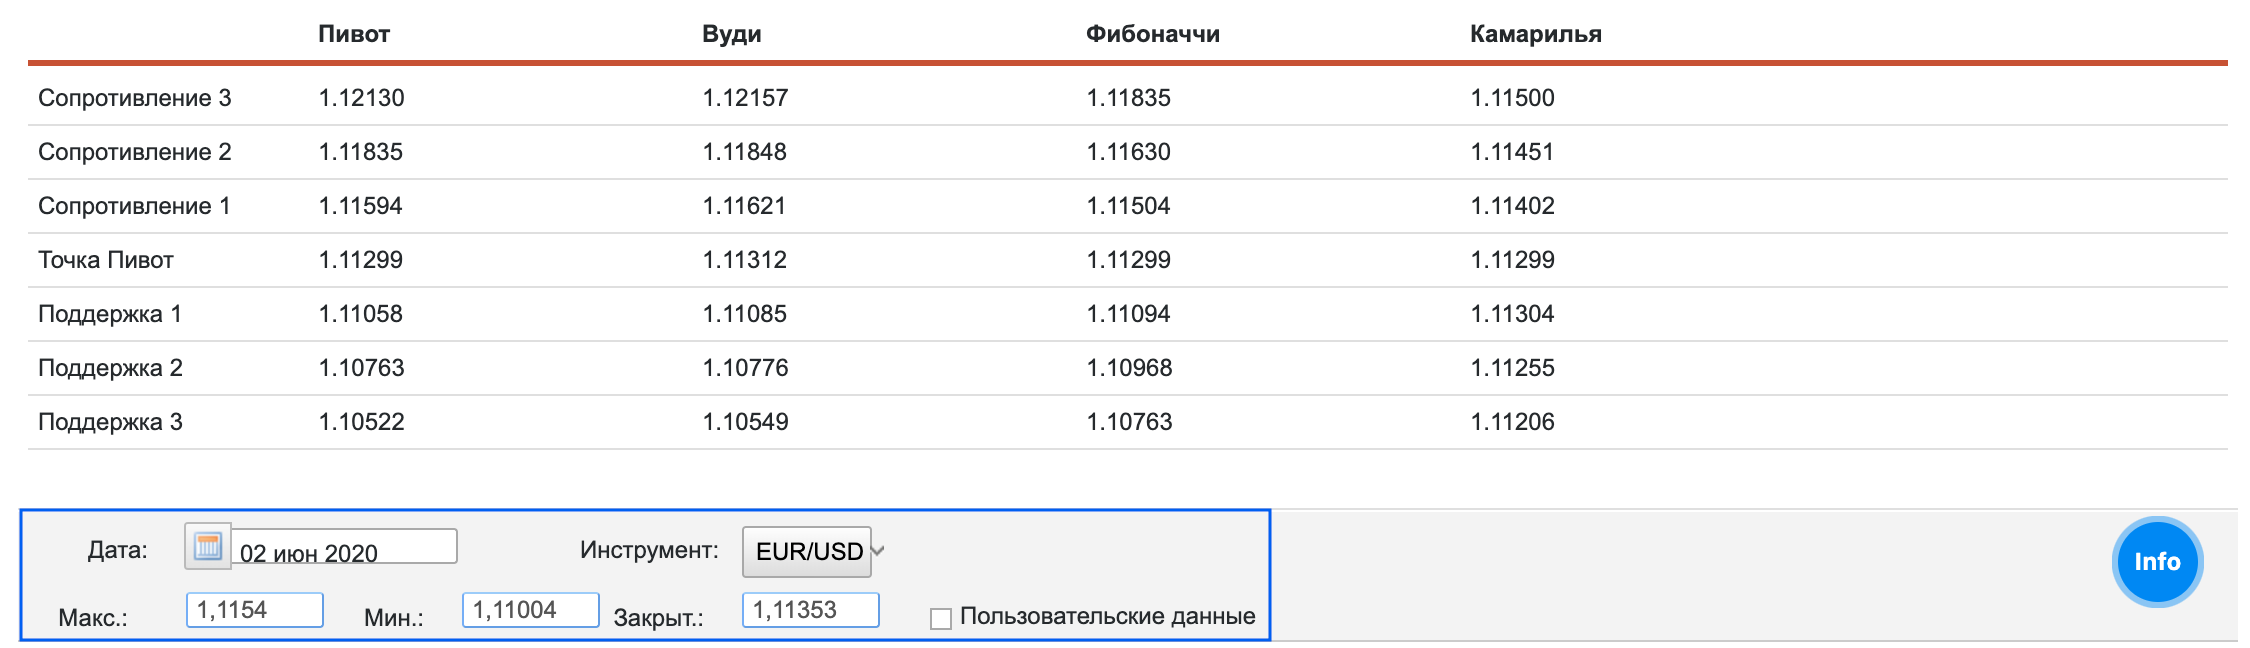
Below you can set the date, asset, and custom price.
Example
Select currency pair, minimum and maximum values. Tick the checkbox if you only want to process customer data.
There is a reference value near each of the levels. If the quotes break it, the trend will persist, and the pullback predicts a reversal.