SWFX Market Sentiment Index

SWFX Market Sentiment Index
The tool will help to identify trends, find divergences, filter the signals of the primary trading strategy, determine overbought/oversold assets.
Instructions
The difference of this widget from similar ones is that it displays not only currencies but also an exhaustive list of assets: stocks, commodities, metals, indices, and futures.
On the top of the widget, there is a switch between currencies and other instruments.
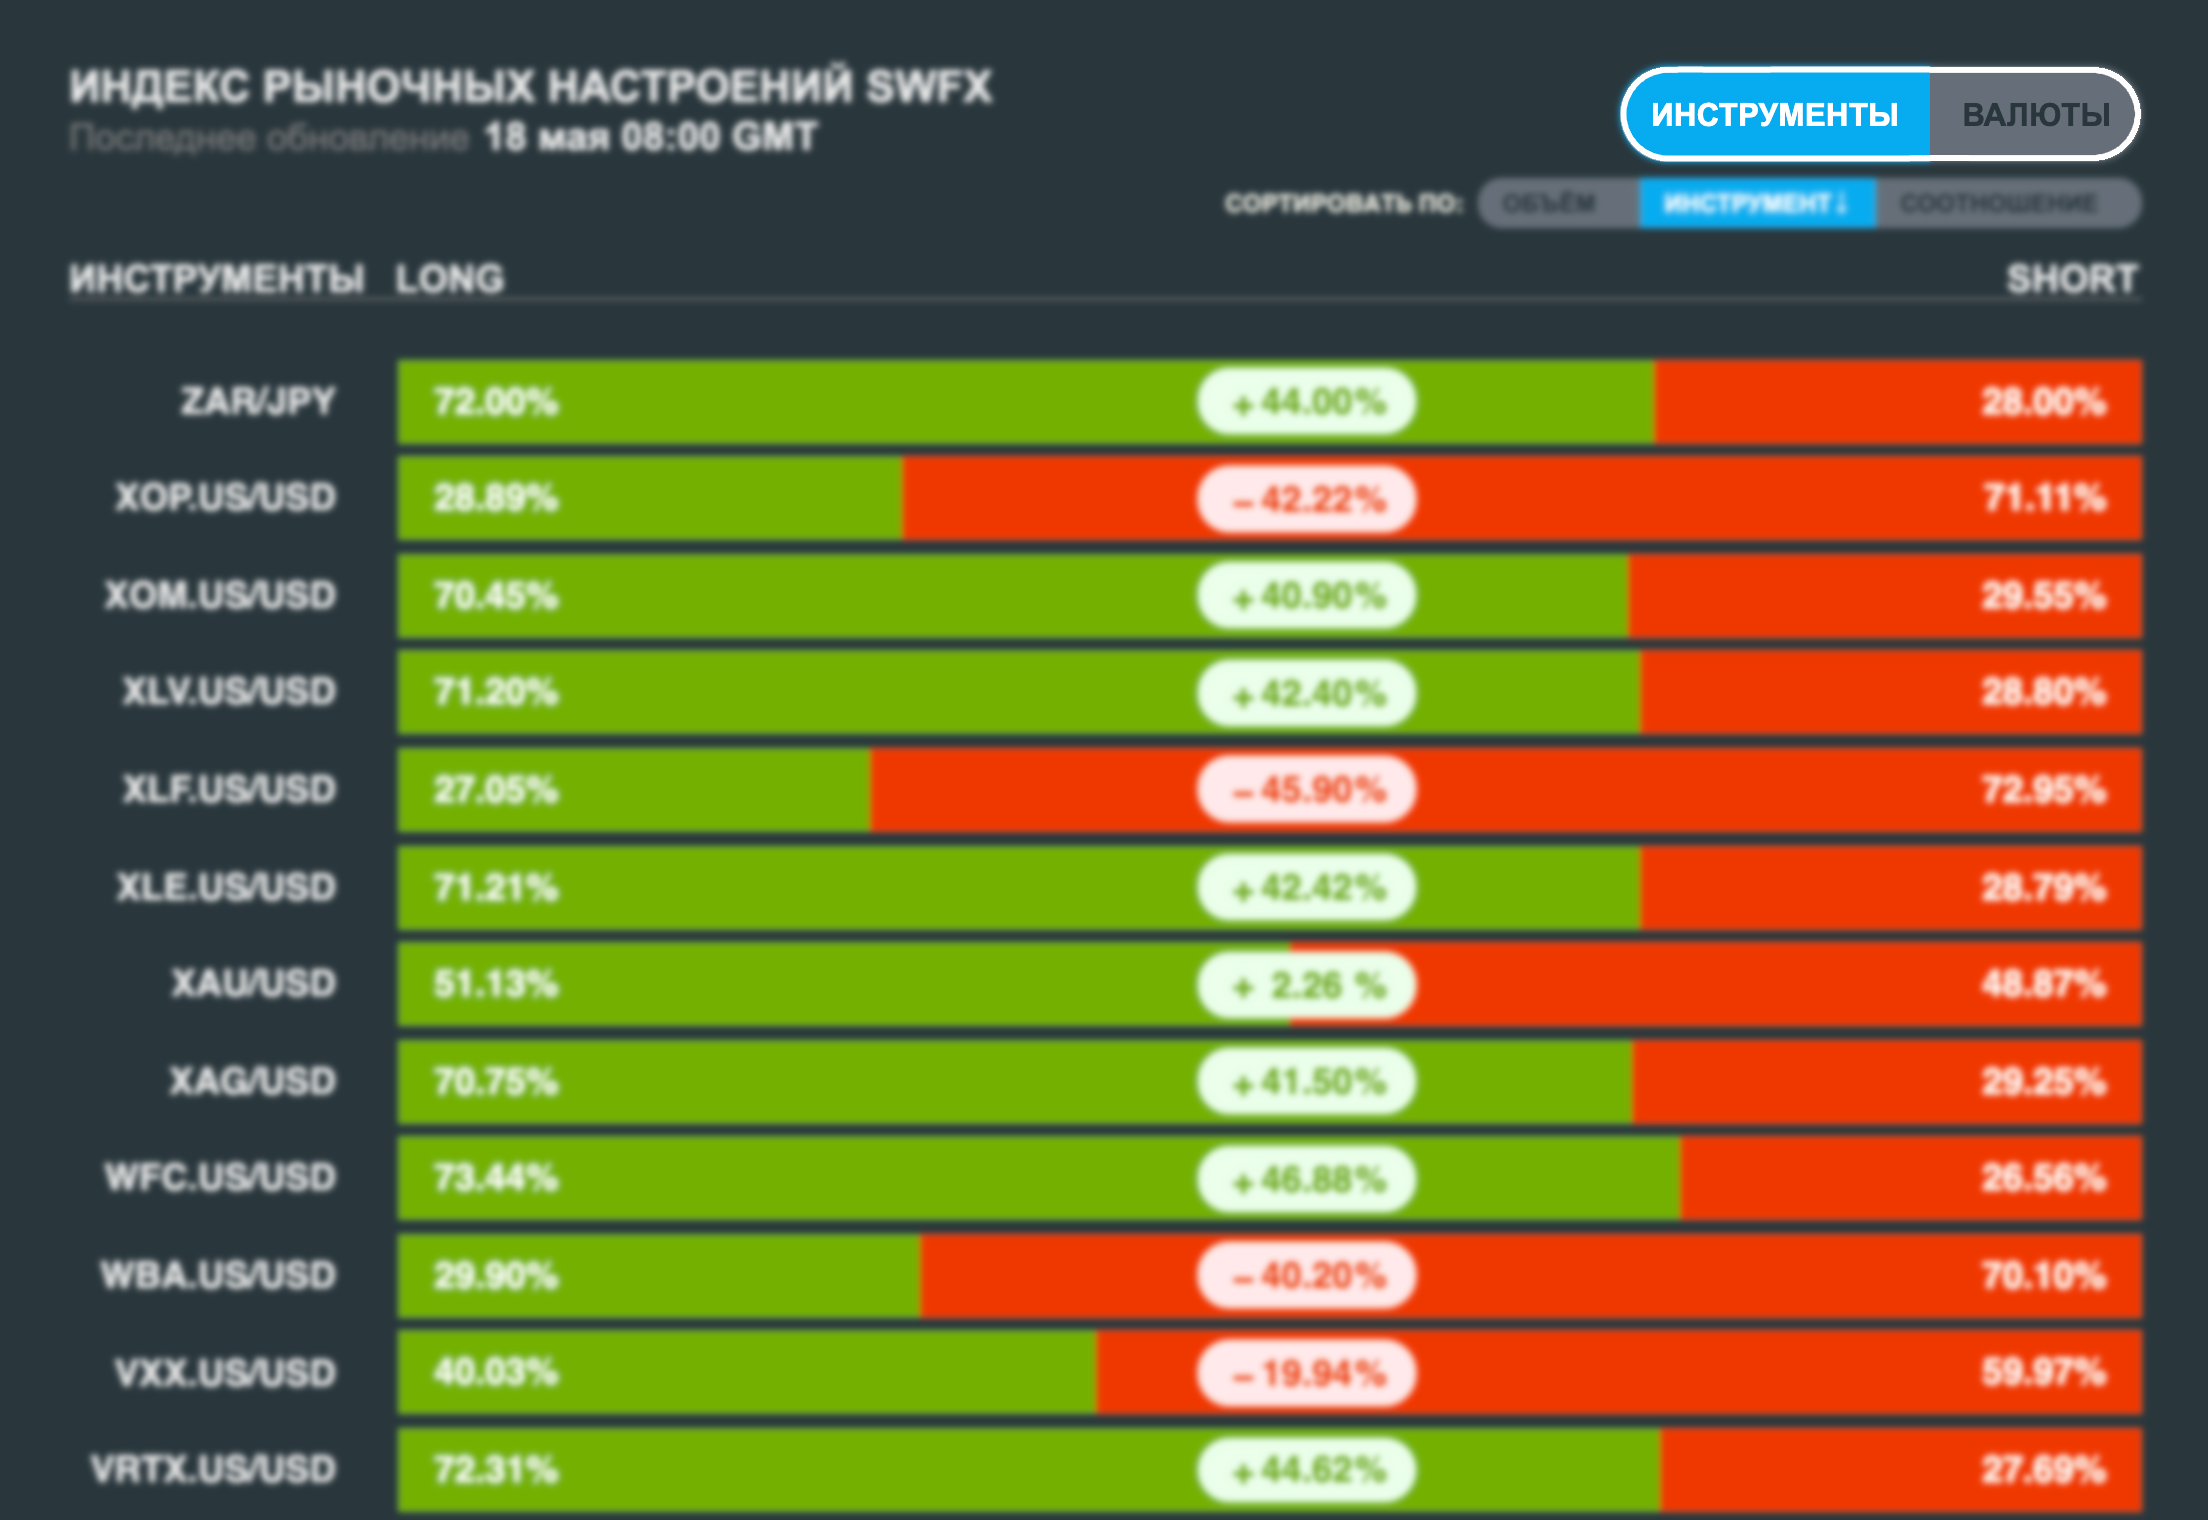
Below are filters by volume of invested funds and instruments in alphabetical order and ratio, sorted by the value of the difference of short and long positions.
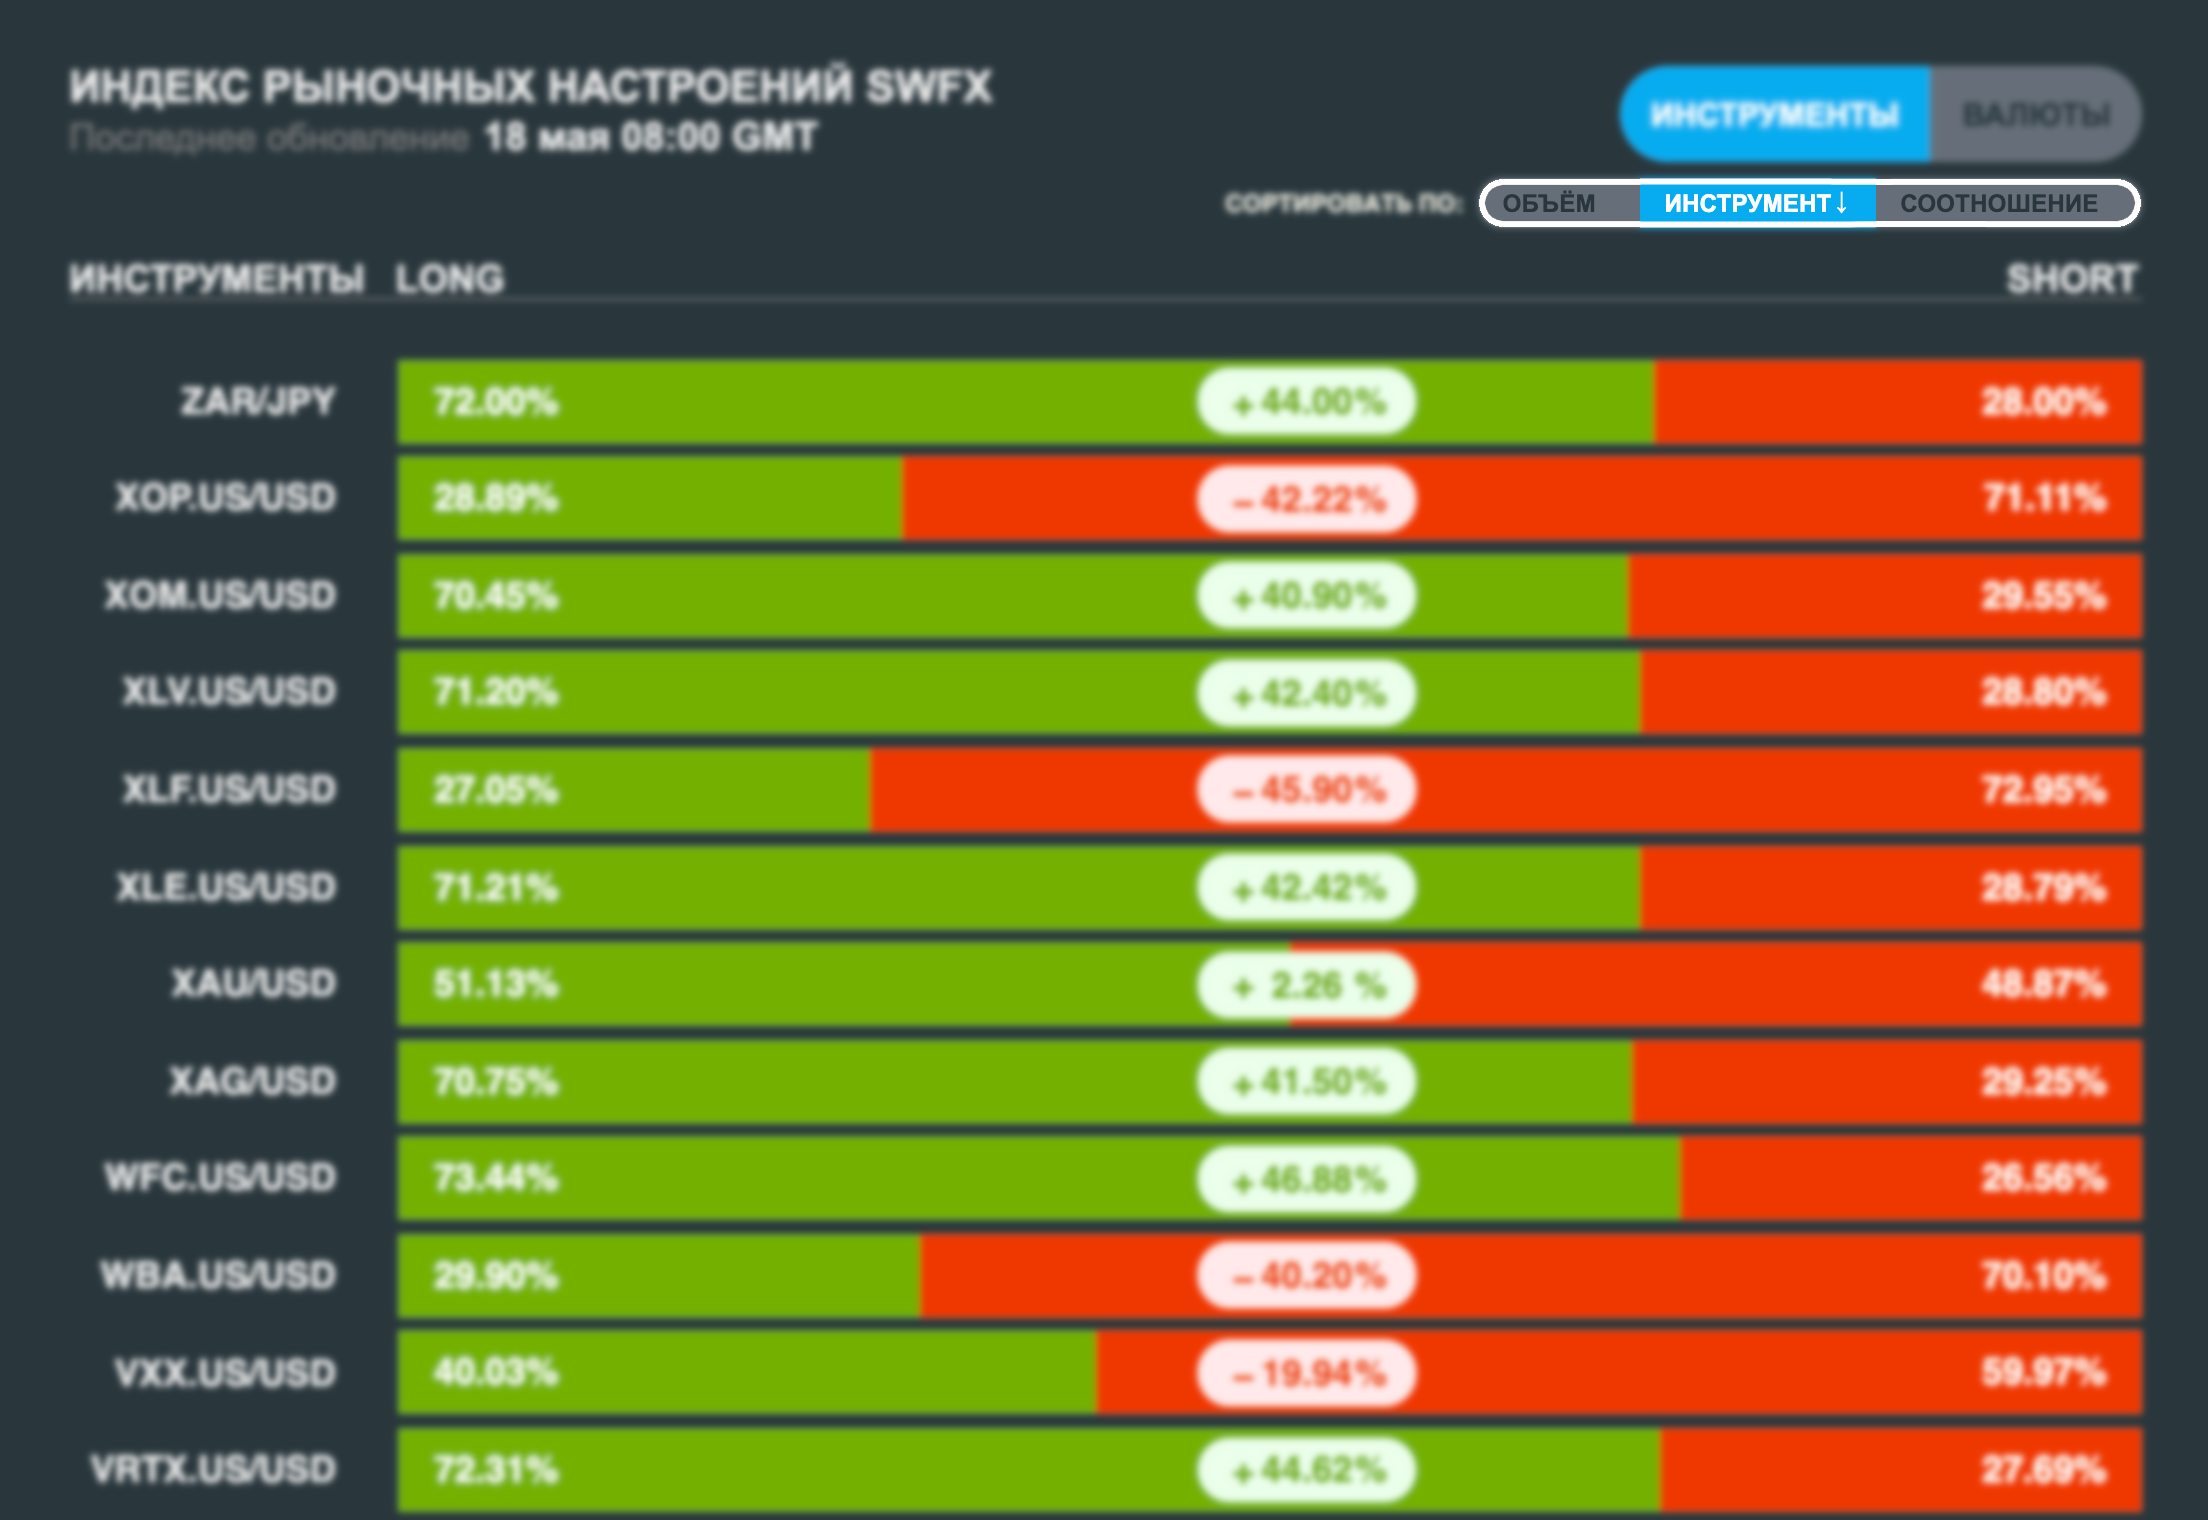
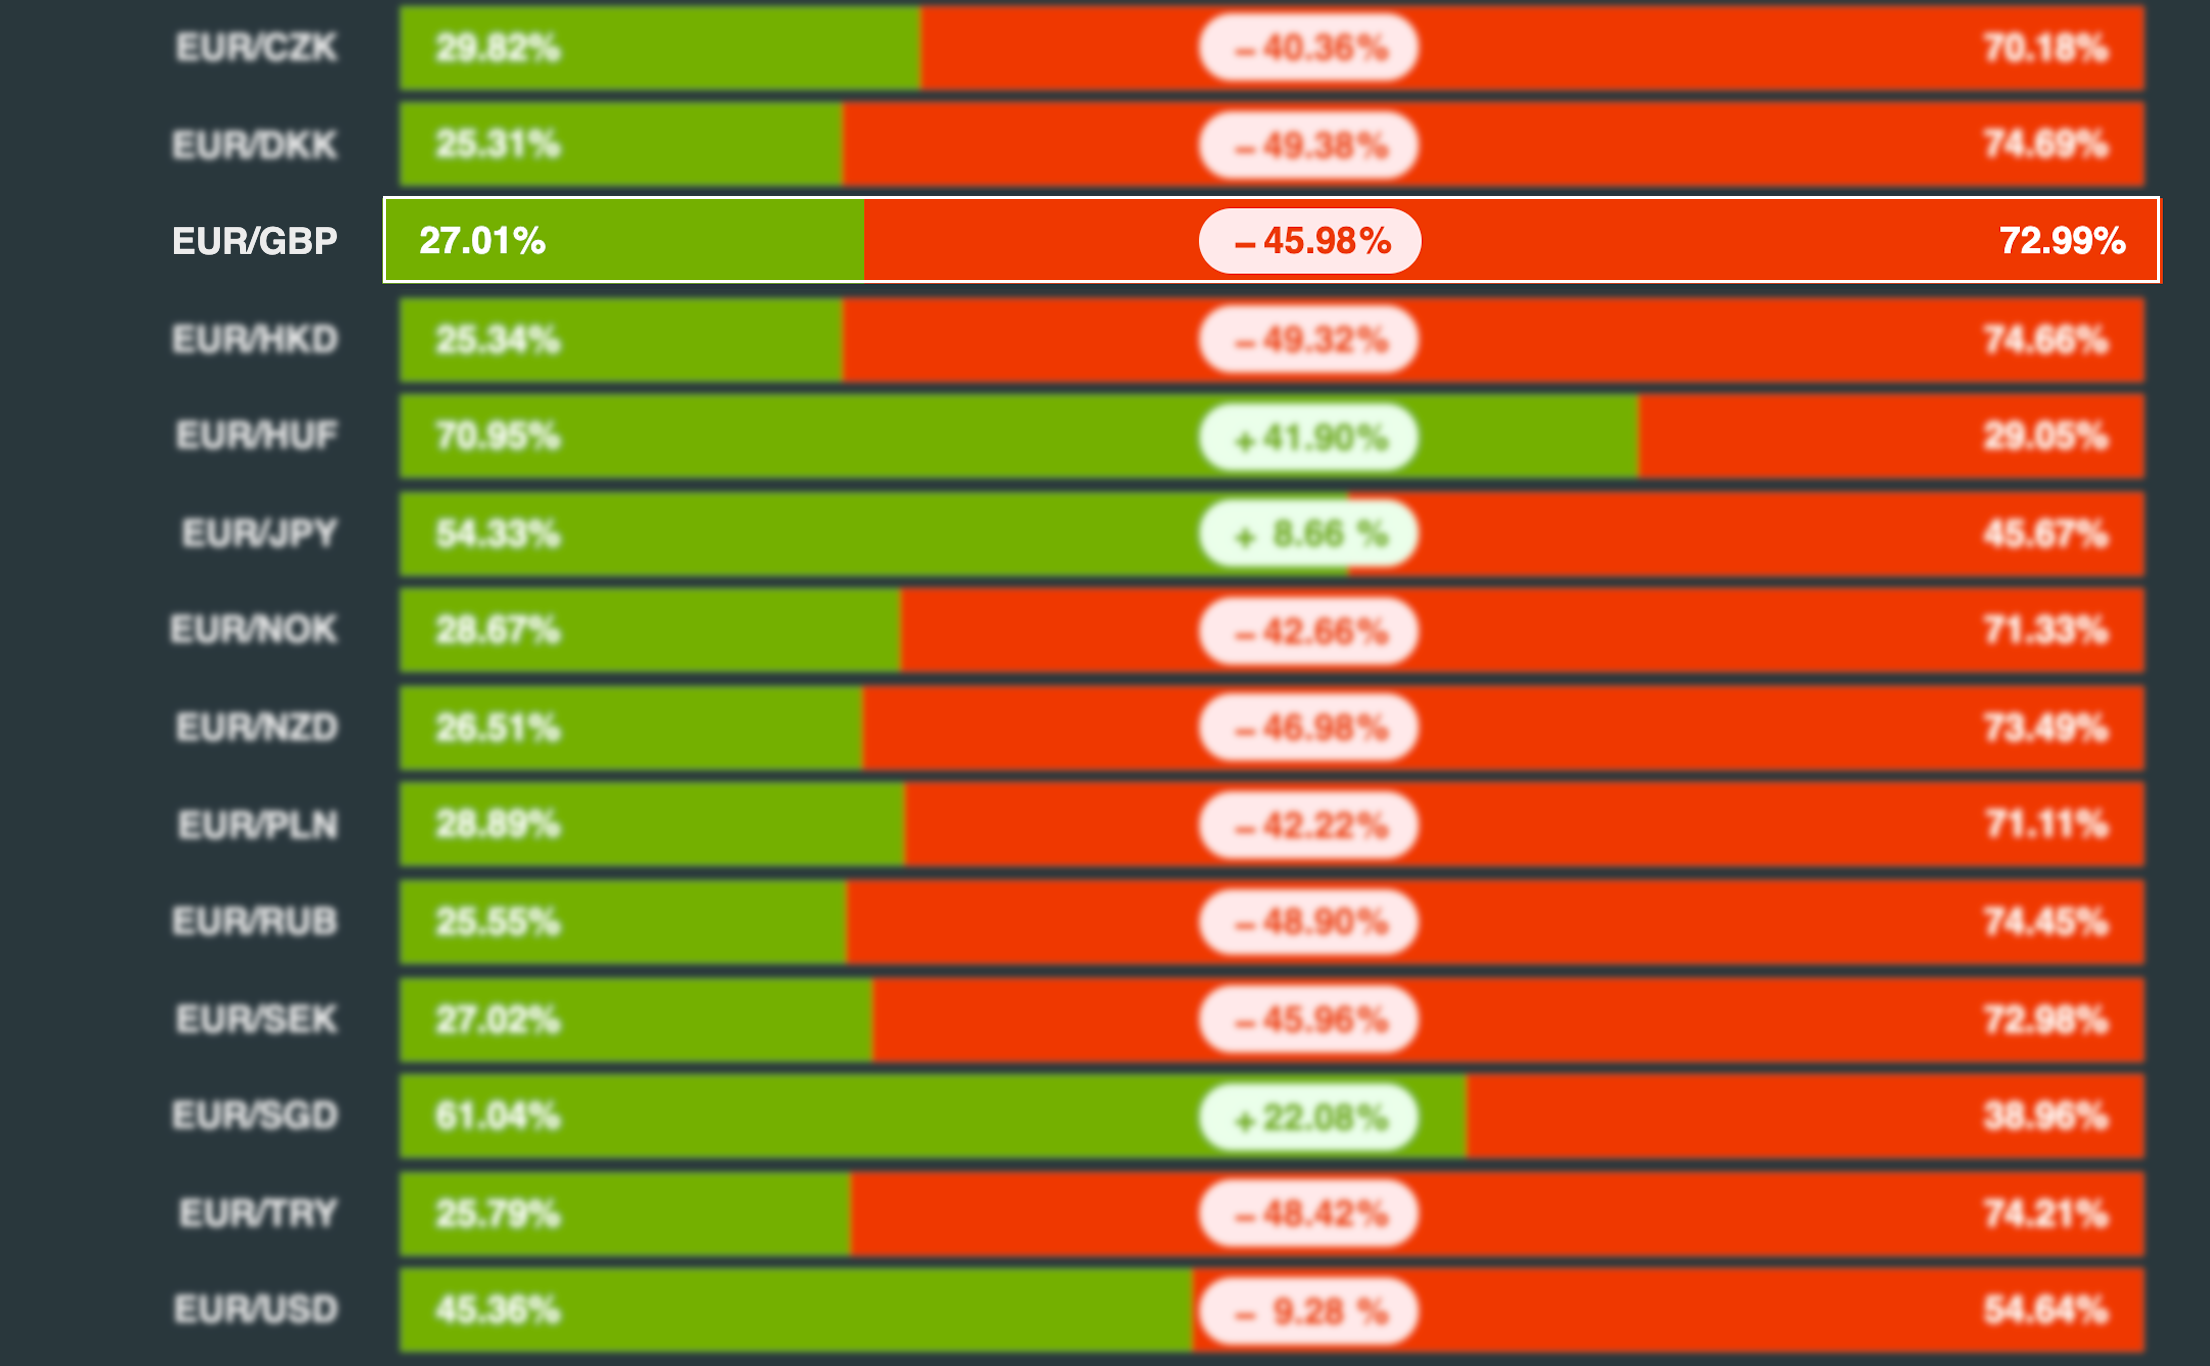
The left part of the green is the percentage of long positions, and the right red part shows short positions. In the center is the deviation value (long-short).

Example
The signals on the screenshot show that it is worthwhile to make a sell deal on the EUR/GBP currency pair. But the index shows that short positions prevail in the market. This is a sign that the asset is already oversold, and it is not worthwhile to place a short position.